eventstats
 (Eventstats) - Events statistics LIMITED
Eventstats is a power that allows you to see graphical summaries about the events in your chat. For example, how many kicks and bans have been performed in the selected window.
Note: It can take up to 10 minutes for eventstats to update.
If you are looking for a list of the events of your chat group, please check Events power. Also note Events power is not required to use Eventstats.
Eventstats Search
You can search for all chat event statistics, or for a single user's statistics. If you want to view all stats click "search" with no ID or Username in the box.
You are able to look for statistics of time up to 14 days.
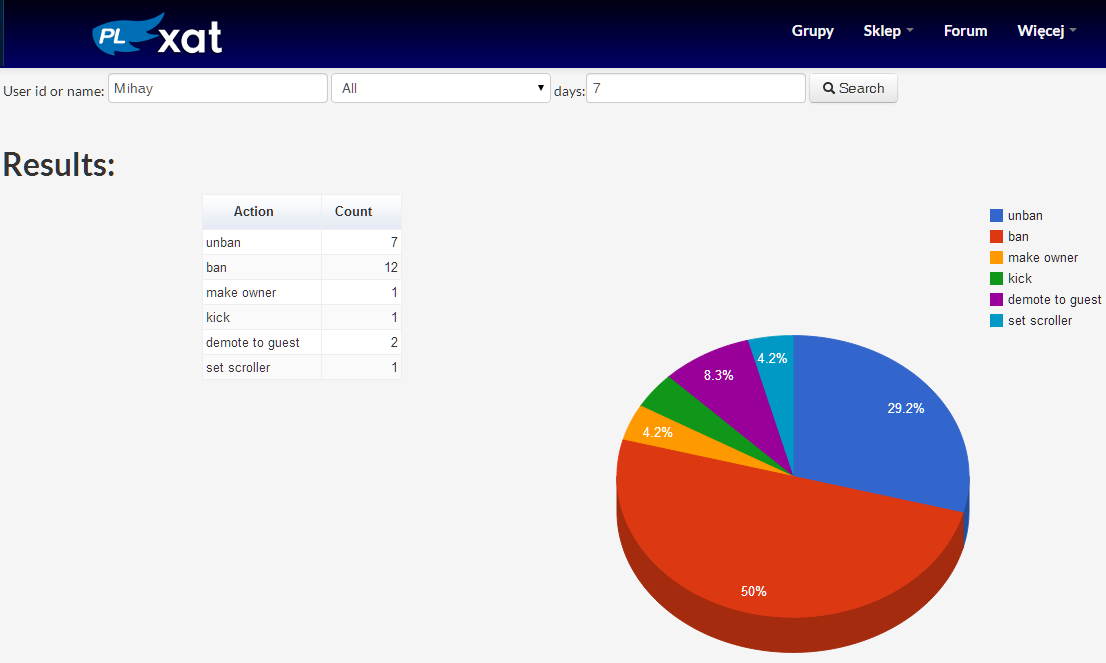
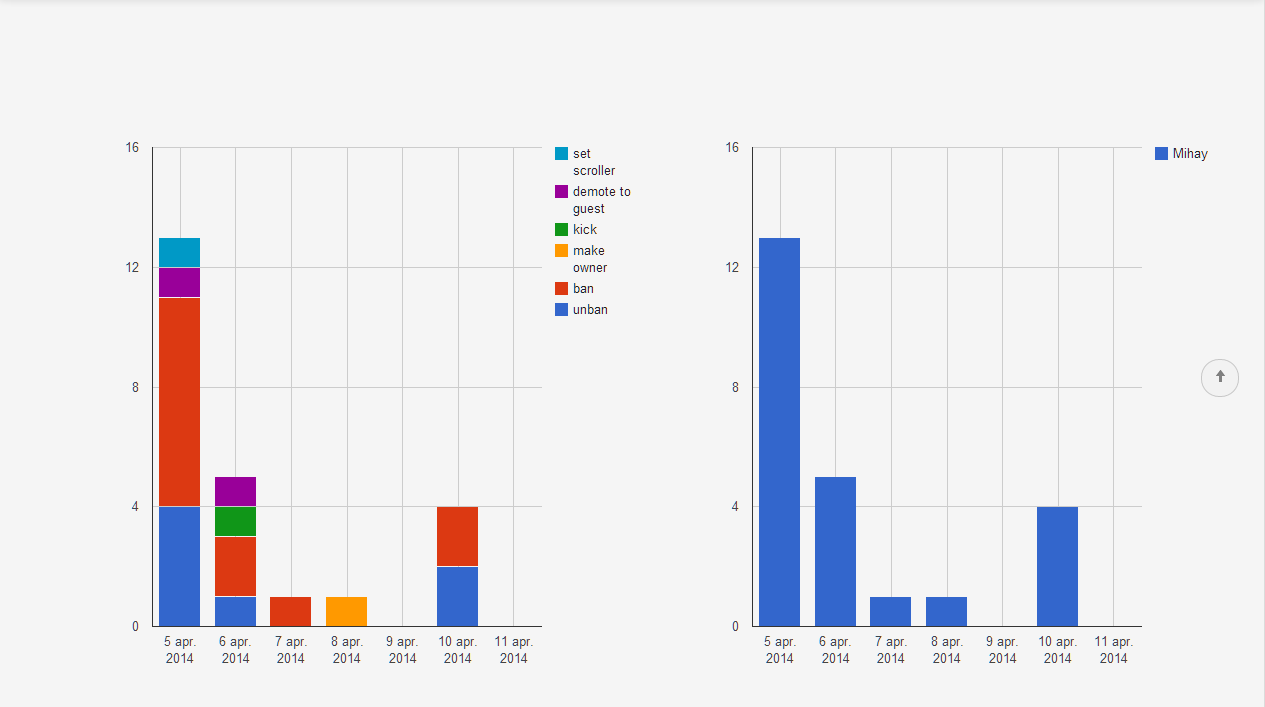
Once submitted, you will be presented three different charts. A pie chart, and two histograms:
The "Pie Chart" is a circular chart divided into sectors, illustrating numerical proportion, for example 25% 75%. It shows you the percentage of the user's or chat's actions were of what type.
The "Histograms" are graphical representations of the distribution of data. Here you are able to see the distribution of actions over so many days.


